Dollar Strength vs Emerging Markets: EEM vs DXY Technical Analysis
In late September 2025 we’ve seen a softening US dollar as emerging-market equities rally. The iShares MSCI Emerging Markets ETF (EEM) has climbed to multi-month highs around $53.4 (near its 52-week peak of $53.67) while the US Dollar Index (DXY) has backed off recent highs (~98.6) to test lower support (around 97.6). This inverse action – a weakening dollar and strengthening EEM – is classic. It puts the EEM vs DXY chart squarely on the radar, especially with key Fed/CPI jobs data on the way.
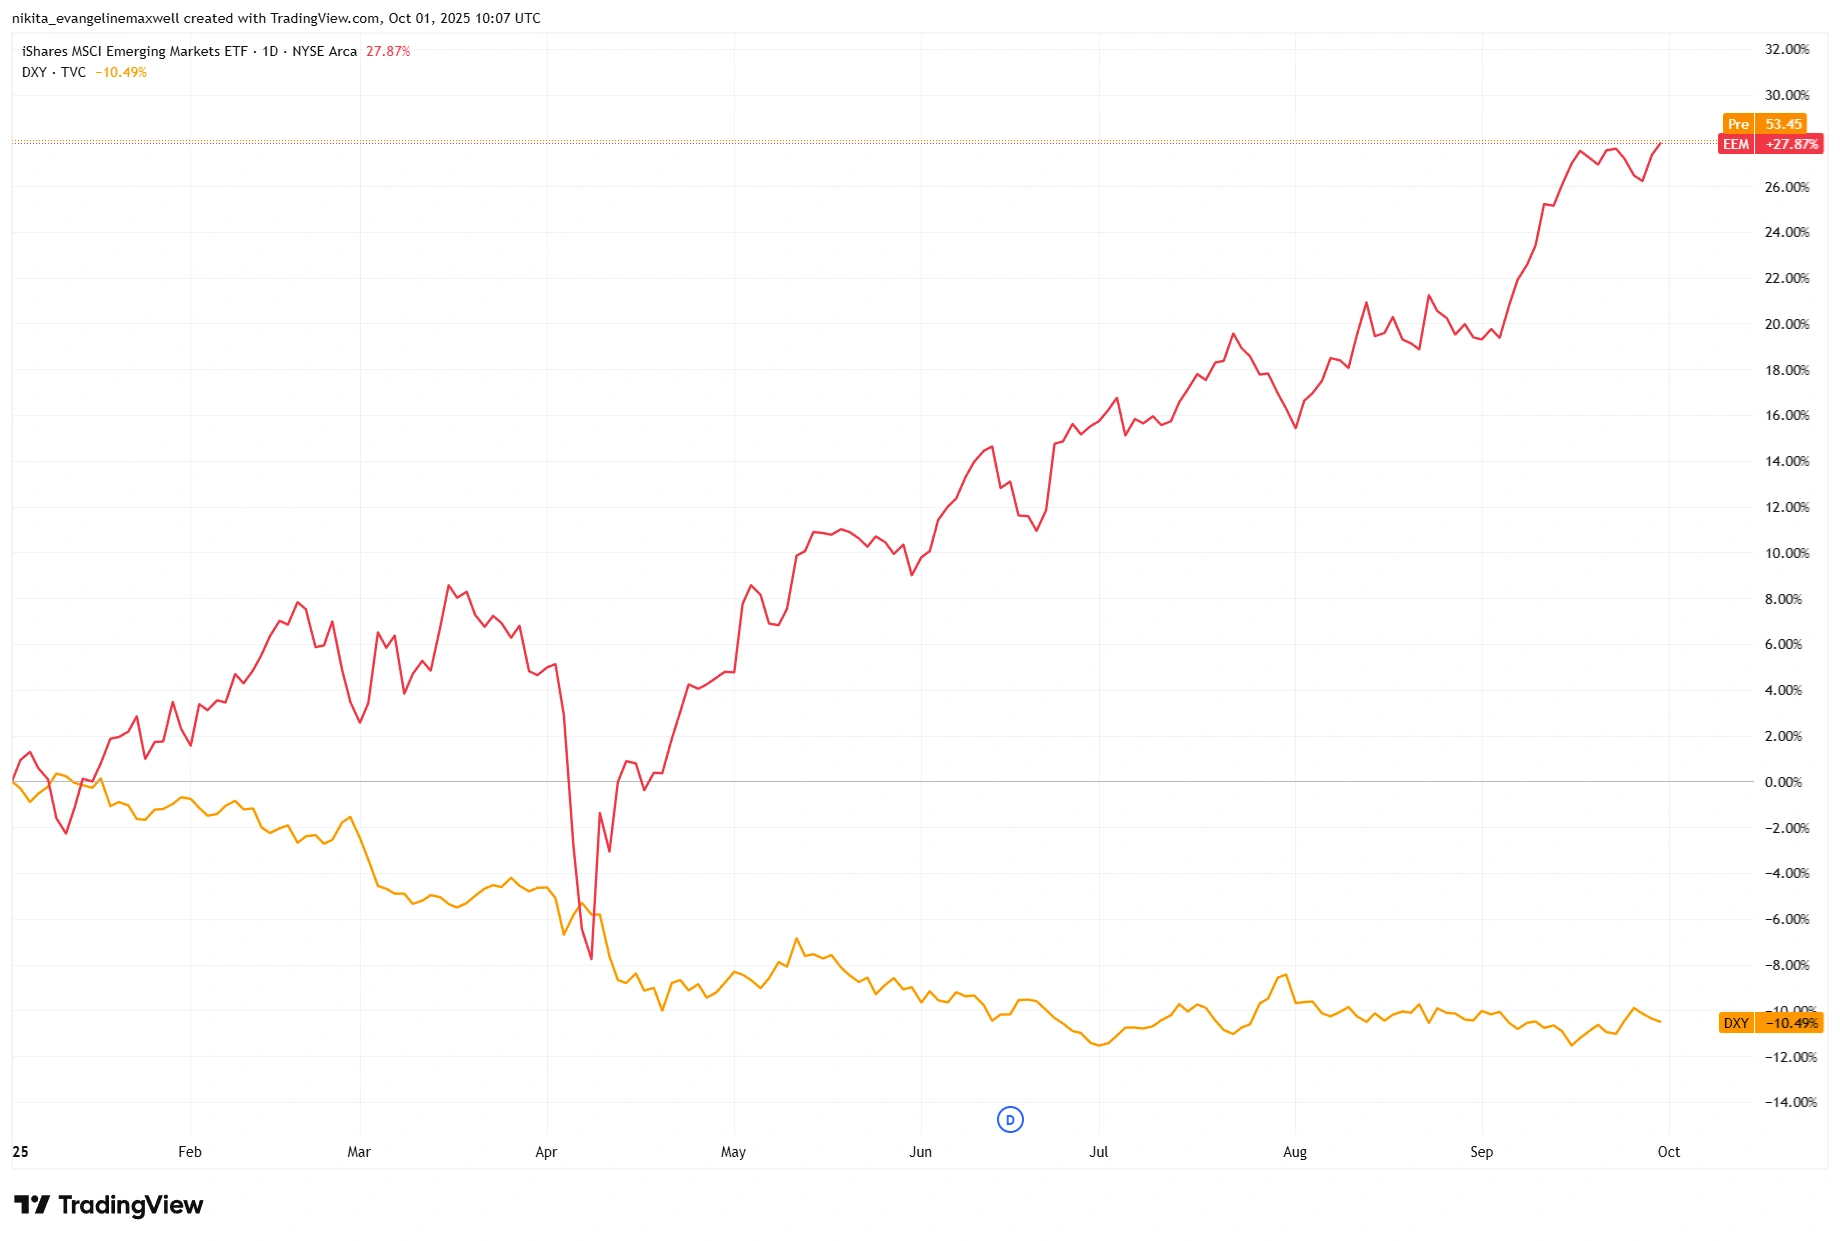
Relative Chart: EEM vs DXY

Source: TradingView. All indices are total return in US dollars. Past performance is not a reliable indicator of future performance. Data as of 1 October 2025.
Emerging markets have rallied nearly +28% while the US Dollar Index has dropped over -10%, underscoring the classic inverse relationship.
Technical Drivers & Key Levels
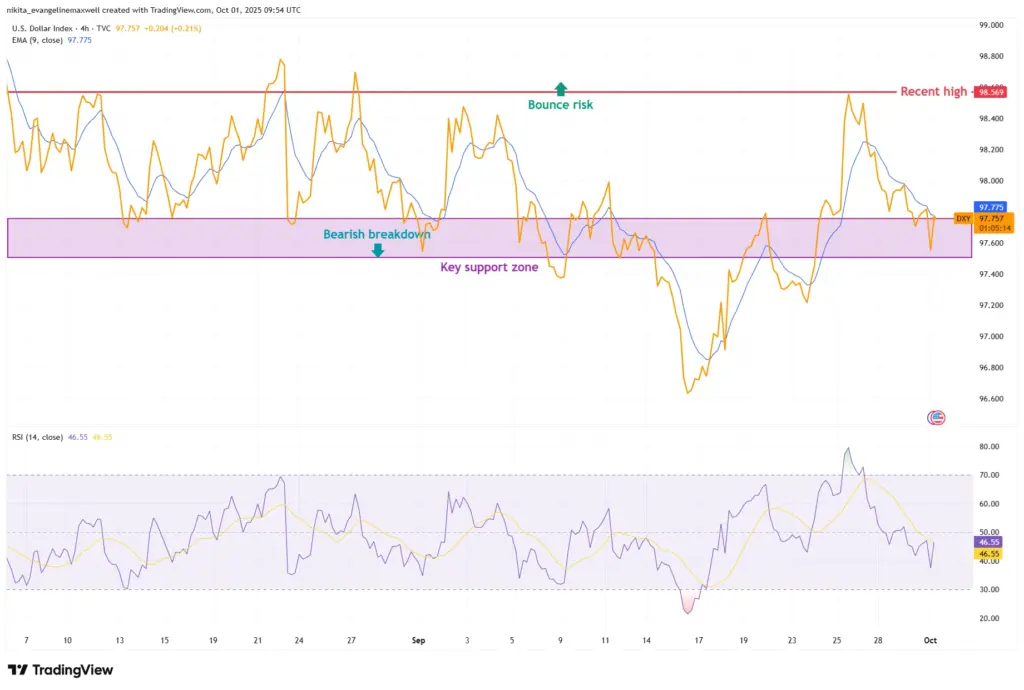
The dollar lost steam after hitting 98.6 and has slipped back toward the 97.7-97.5 region. This area has acted like a floor recently – whenever the index dipped here, buyers stepped in. If that happens again, we could see the dollar bounce back toward 98.5. But if the floor gives way this time, the move lower may have further to run.
US Dollar Index (DXY 4H): Testing 97.7-97.5 Support Zone

Source: TradingView. All indices are total return in US dollars. Past performance is not a reliable indicator of future performance. Data as of 1 October 2025.
DXY has eased off its highs and is now sitting at an important “floor” near 97.7-97.5. Holding here could spark a bounce, but a break below would leave it vulnerable to more selling.
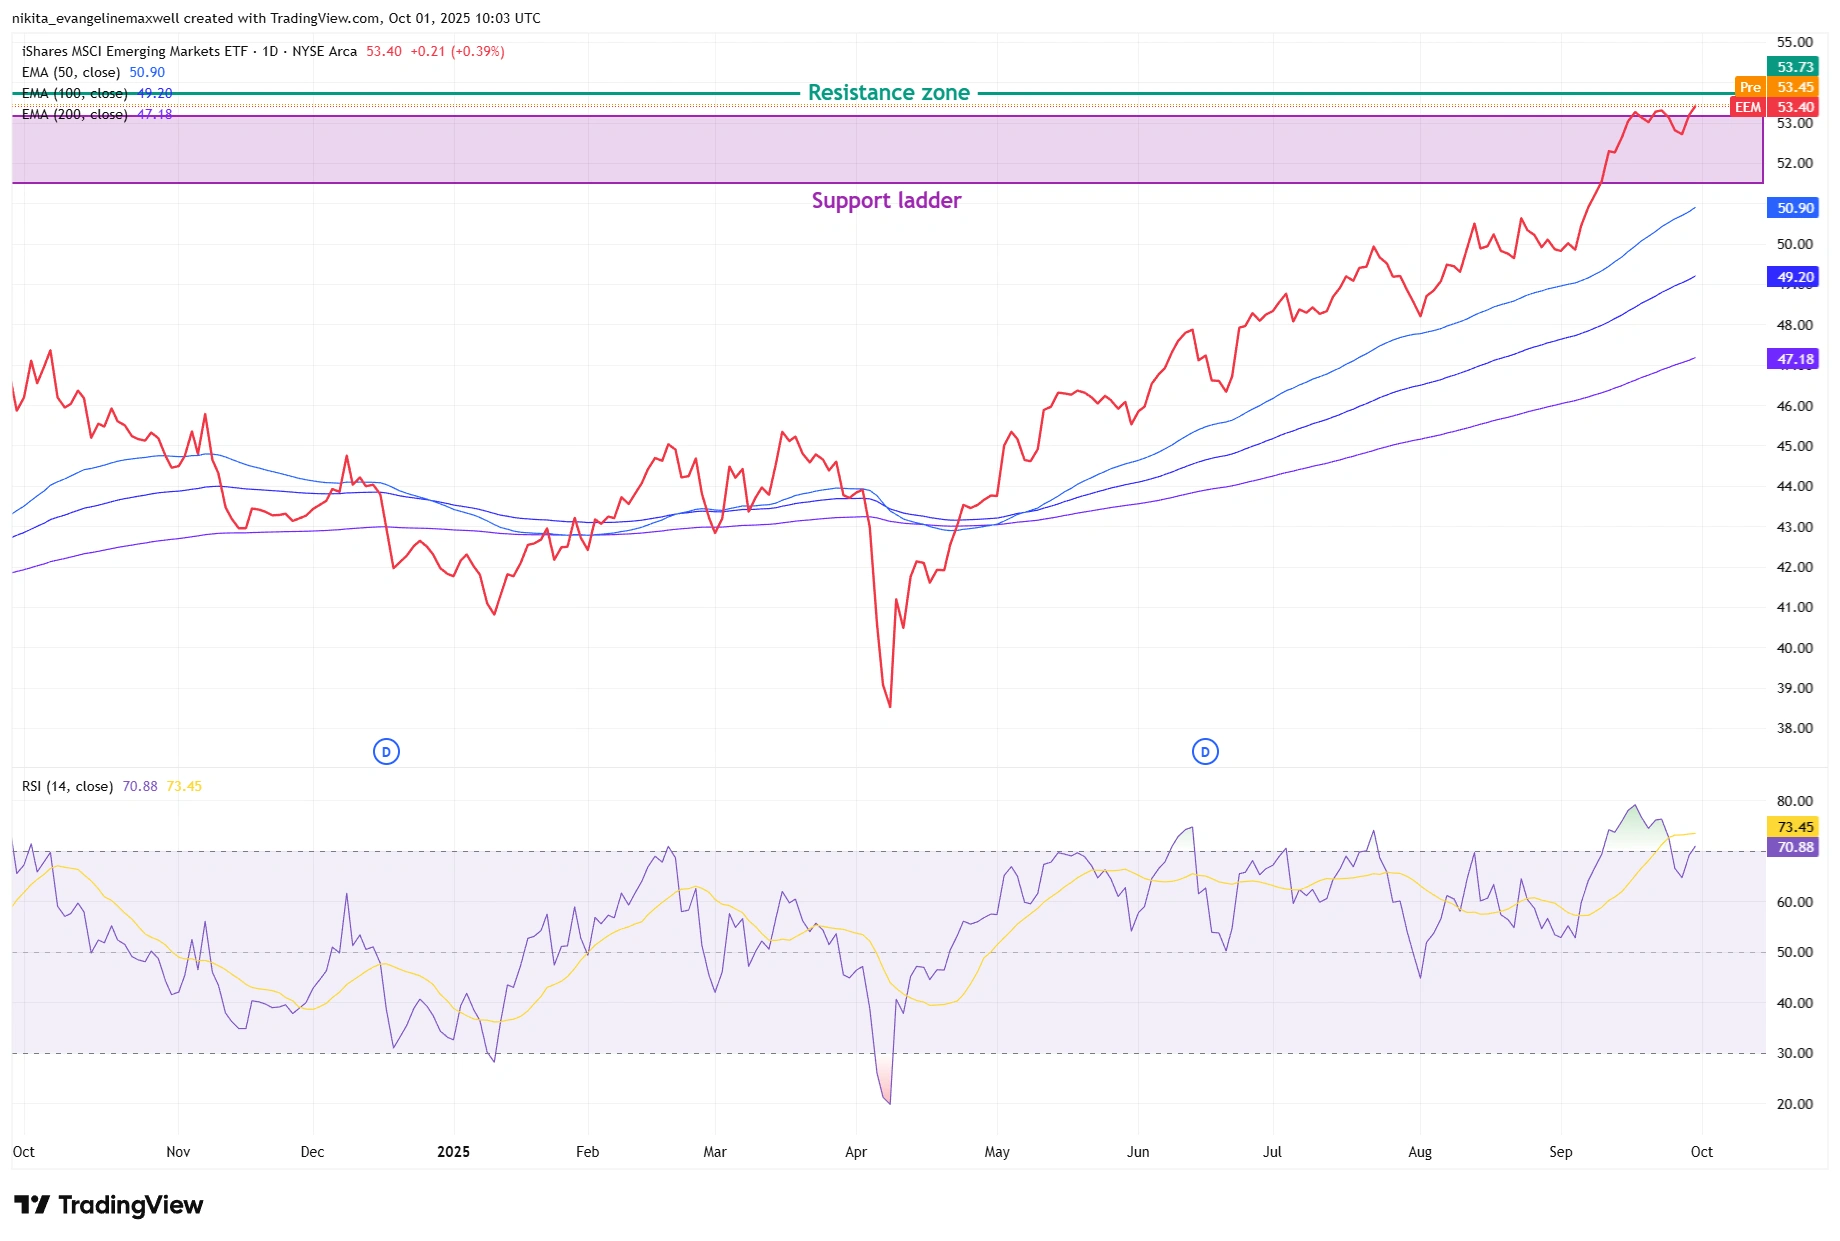
EEM has been climbing steadily and is now pushing into the $53.7-54.0 area, which has acted like a ceiling in the past. If it clears this barrier, the next leg higher could open up quickly. On the downside, the ETF has plenty of cushions: first around $53.0, then near $52.0 where buyers have stepped in before. The overall trend is still strong – price has been making higher highs and higher lows for months, and momentum looks healthy without being stretched. In short, EEM is testing resistance at the top of its range, with support building just below.
EEM Daily Chart: Testing $54 Resistance in Strong Uptrend

Source: TradingView. All indices are total return in US dollars. Past performance is not a reliable indicator of future performance. Data as of 1 October 2025.
EEM Daily Chart: Testing $53.7-54.0 resistance while building a support ladder at $53.0 → $52.0 → $51.5. RSI near 70 signals strong momentum but warns of overbought risk.
Momentum and Chart Patterns
At present neither chart shows a clear reversal signal – momentum still favours the trend. On EEM’s daily chart, there’s no obvious bearish divergence in the RSI or MACD and volume/advances have picked up in the rally. Traders will watch for continuation patterns. Conversely, a failure below the $53 pivot line and a drop in MACD could hint at a short-term top.
On the dollar, the 4-hour chart has been showing a tug of war. After climbing to 98.6, it slipped back and is now leaning on support near 97.7. If that floor gives way, it could mark the start of another down-leg. If it holds, the dollar may try another push higher, but it needs to prove it still has strength.
EEM, on the other hand, has been holding its ground above $53. If it consolidates here and breaks higher, the rally could extend. But if it slips back under $53, traders might take that as a sign momentum is fading. For now, both charts are sending mixed signals – steady trends but with key levels being tested.
Risks and What Traders Are Watching
While charts set the levels, events will decide direction. Fed policy, US inflation and jobs data remain front and centre – dovish surprises tend to weaken the dollar and lift EMs, while strong numbers would do the opposite. Earnings season and geopolitical headlines can also sway risk appetite. In short, even clean technical setups can flip fast if the news flow changes.
Bottom Line
Both charts are sitting at decision points. If the dollar holds above 97.7 and rebounds, emerging markets could stall. But if DXY slips under 97.5 while EEM pushes through the $53.7–54.0 ceiling, the EM rally has room to stretch. Right now, momentum favours EEM, but upcoming Fed, inflation, and jobs data will likely decide the next move.