Big Tech Dominance: Is the Rally Slowing?
The US stock market is sitting at all-time highs, but the rally has been unusually narrow. Almost all the gains have come from a few megacap tech names. Since April, the S&P 500 has jumped about 27%, with the “Magnificent Seven” now making up roughly one-third of the index. Nvidia alone accounts for around 8%, while Microsoft and Apple make up about 7% and 6%. Together, those three represent more than a fifth of the S&P. That raises a simple question: can a rally powered by so few stocks keep going, or is momentum starting to crack?
What the Charts Say
Momentum Signals on the S&P 500
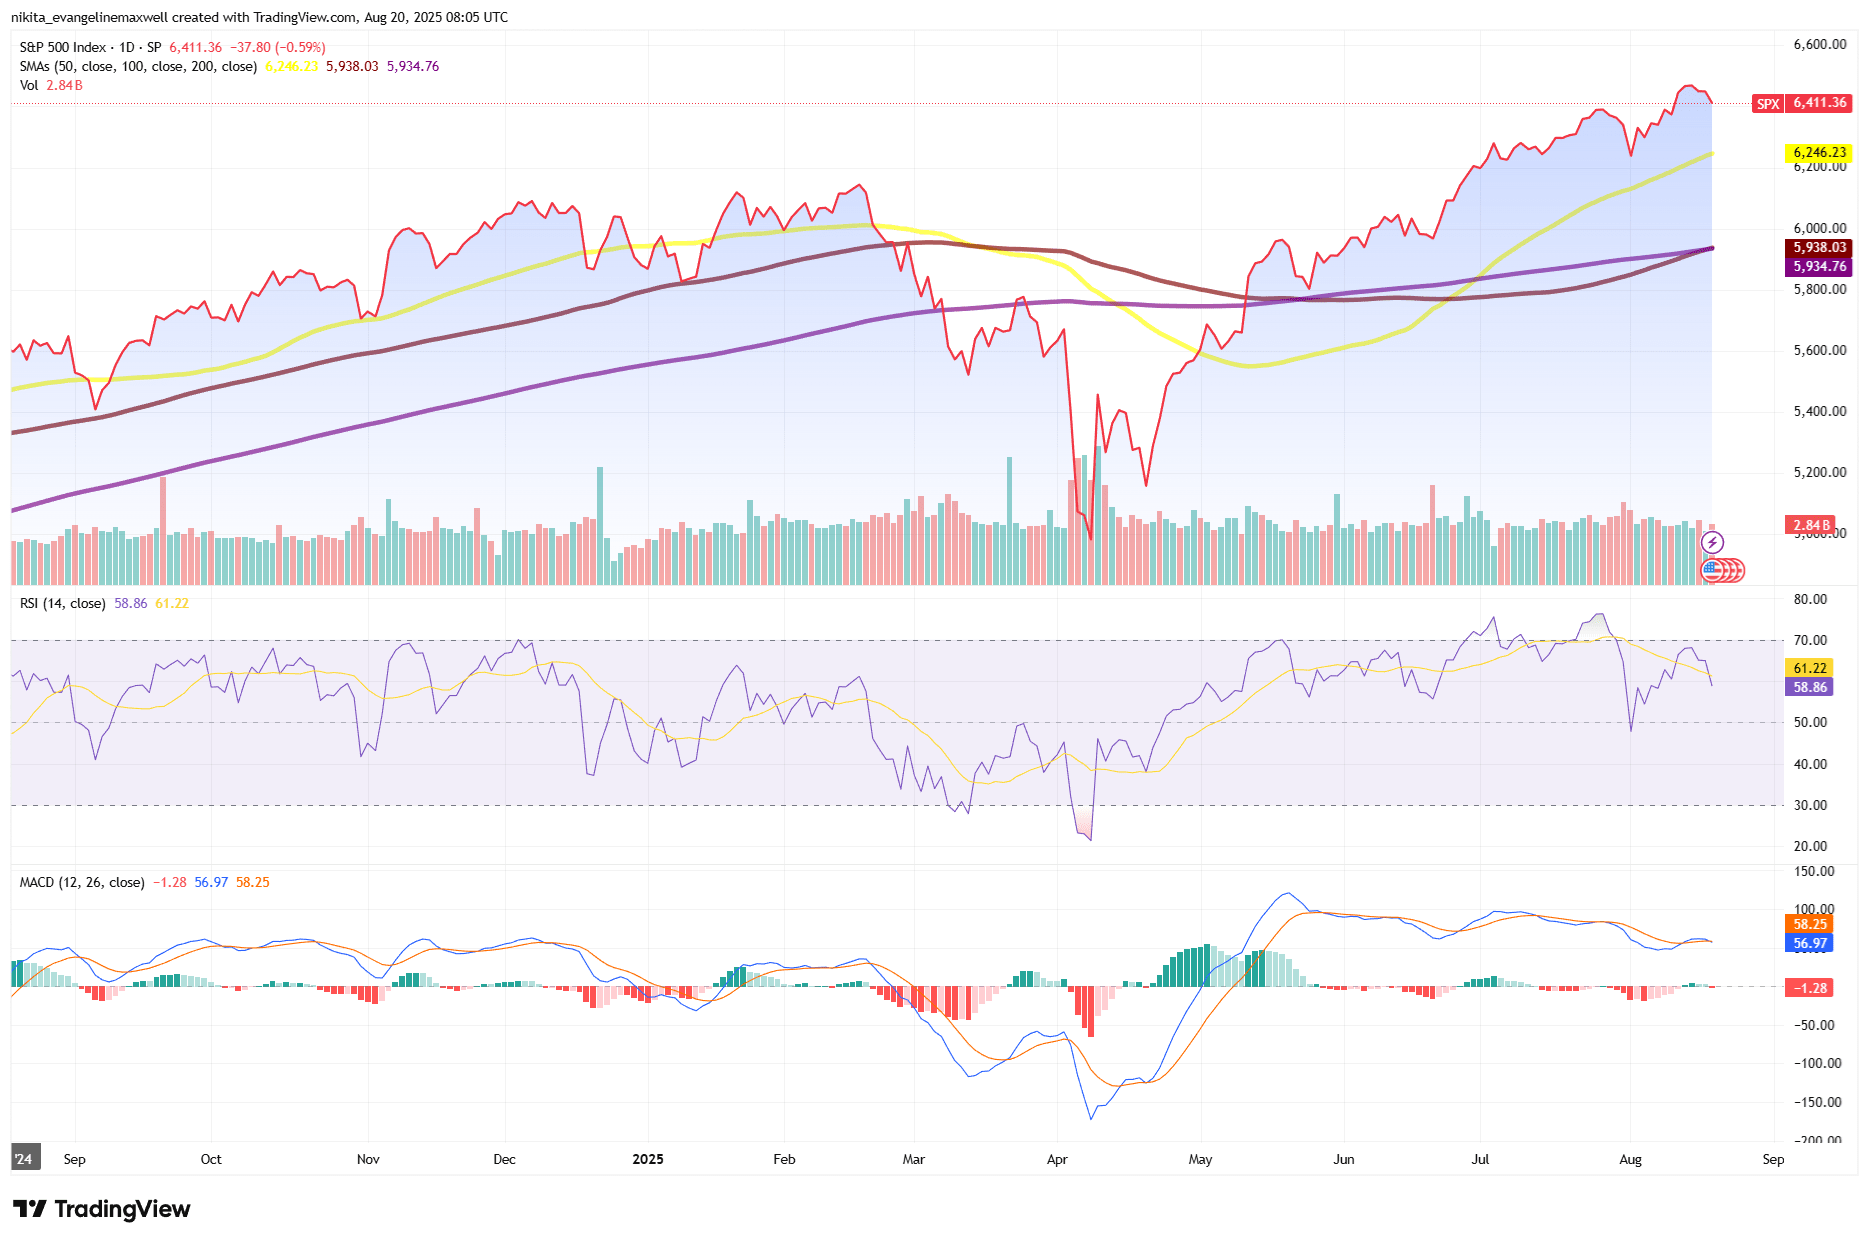
Source: TradingView. All indices are total return in US dollars. Past performance is not a reliable indicator of future performance. Data as of 20 August 2025.
The S&P 500 continues to trend above key moving averages, but volume has been softer on the latest rally.
The S&P 500 has been trending steadily higher since spring, breaking above prior highs and pushing to records. Its technical setup looks constructive: the 50-day average sits above the 100-day, with the 200-day further below.. The RSI is mid-range, not flashing overbought, and the MACD remains positive, though recent histogram bars have softened. Volume, however, has been underwhelming. The takeaway: charts are bullish, but enthusiasm isn’t broad-based.
Megacap Tech vs the S&P 500
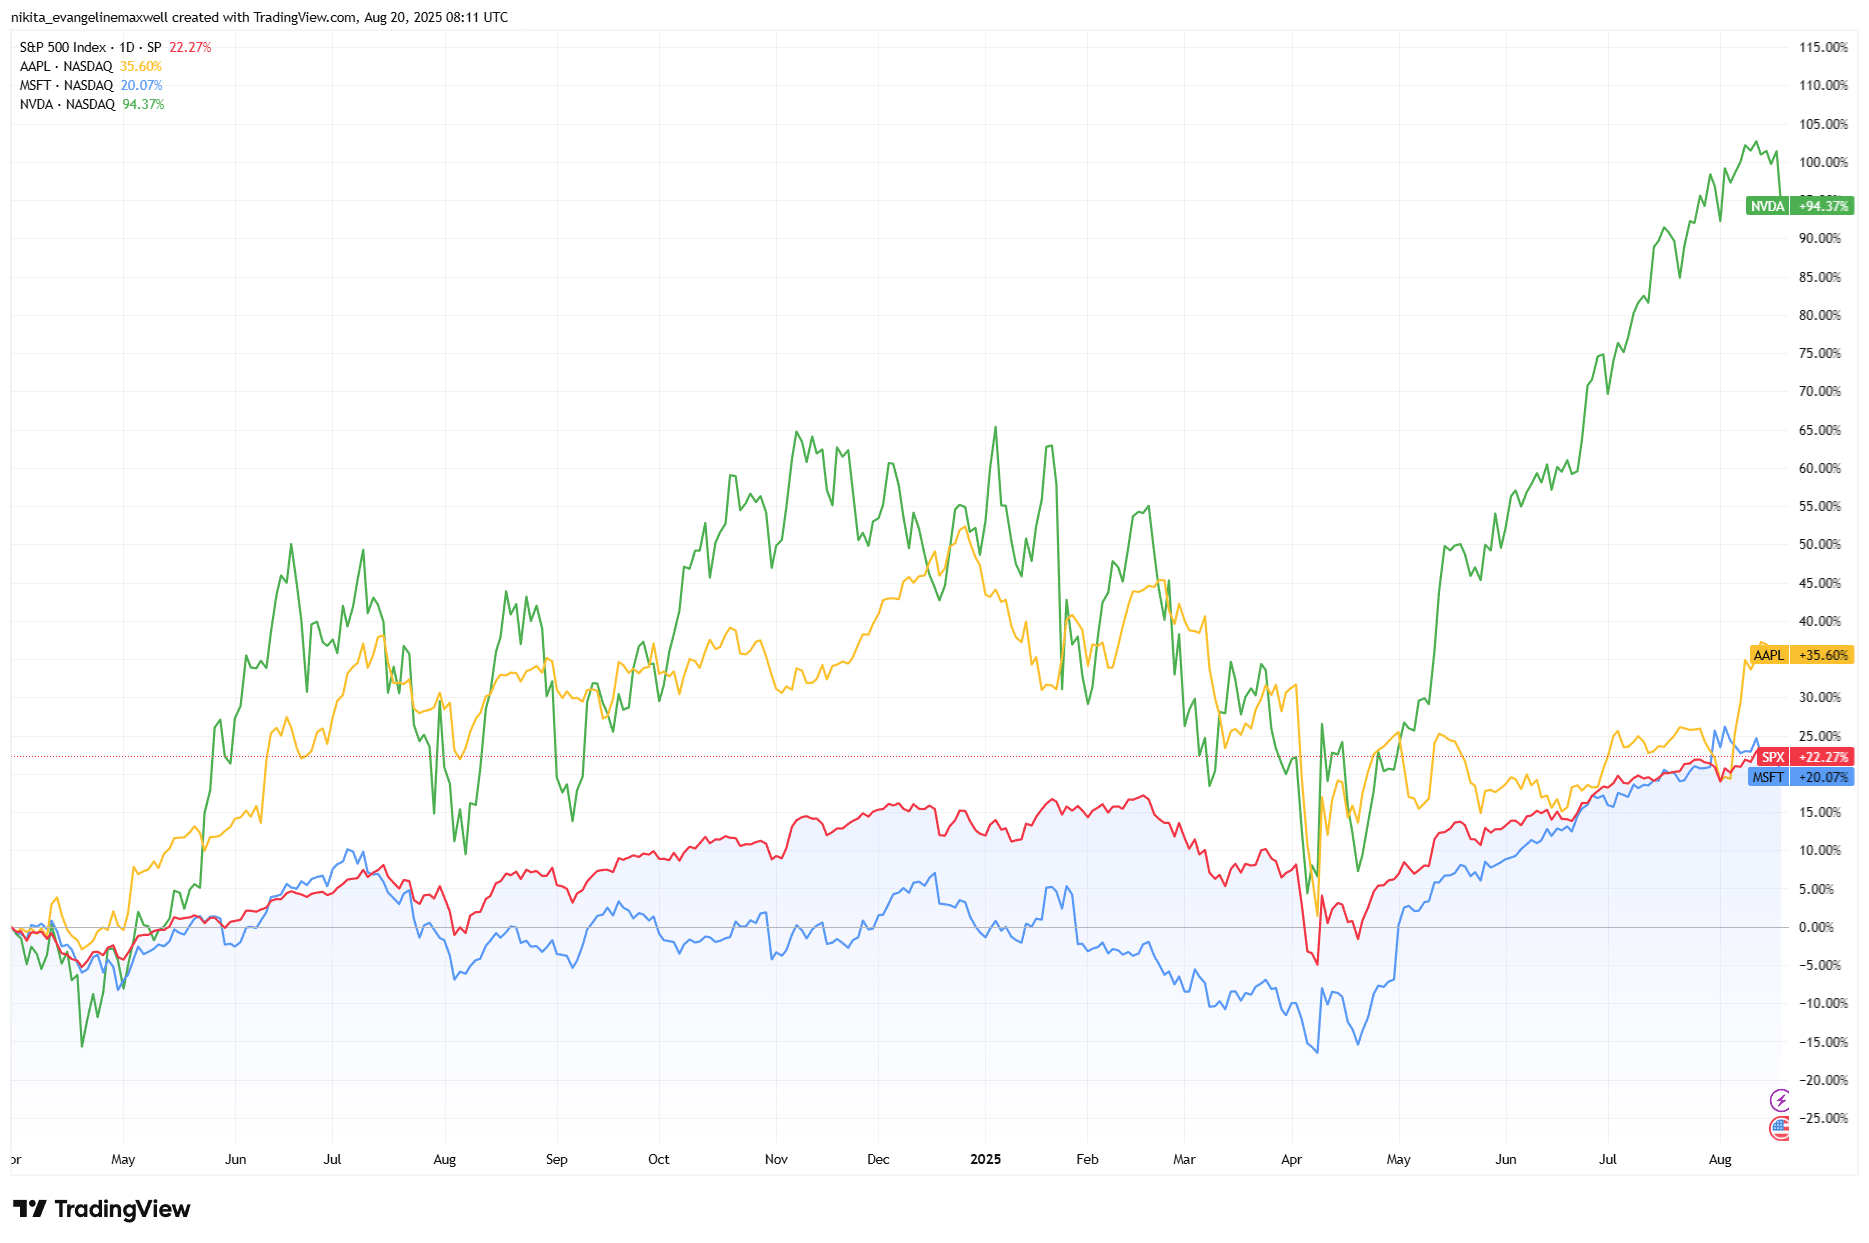
Source: TradingView. All indices are total return in US dollars. Past performance is not a reliable indicator of future performance. Data as of 20 August 2025.
Zooming in, the big three tech names show a similar picture. Apple and Microsoft are holding above their 50-day lines and pressing against resistance. Nvidia, after a huge run, has paused and now hovers just above its 50-day. None look overheated their RSIs remain neutral, but none are breaking out aggressively either. The momentum looks good, but conviction feels lighter.
Bullish vs Bearish Scenarios
Bulls argue this is how healthy rallies behave: steady, and not manic. Pullbacks have consistently found buyers, with bounces off the 50-day averages showing reliable support. Both the S&P and Nasdaq continue to make higher highs and higher lows, while key moving averages are still rising. If the megacaps break fresh highs, they’ll likely pull the indices higher too.
Nasdaq RSI Divergence
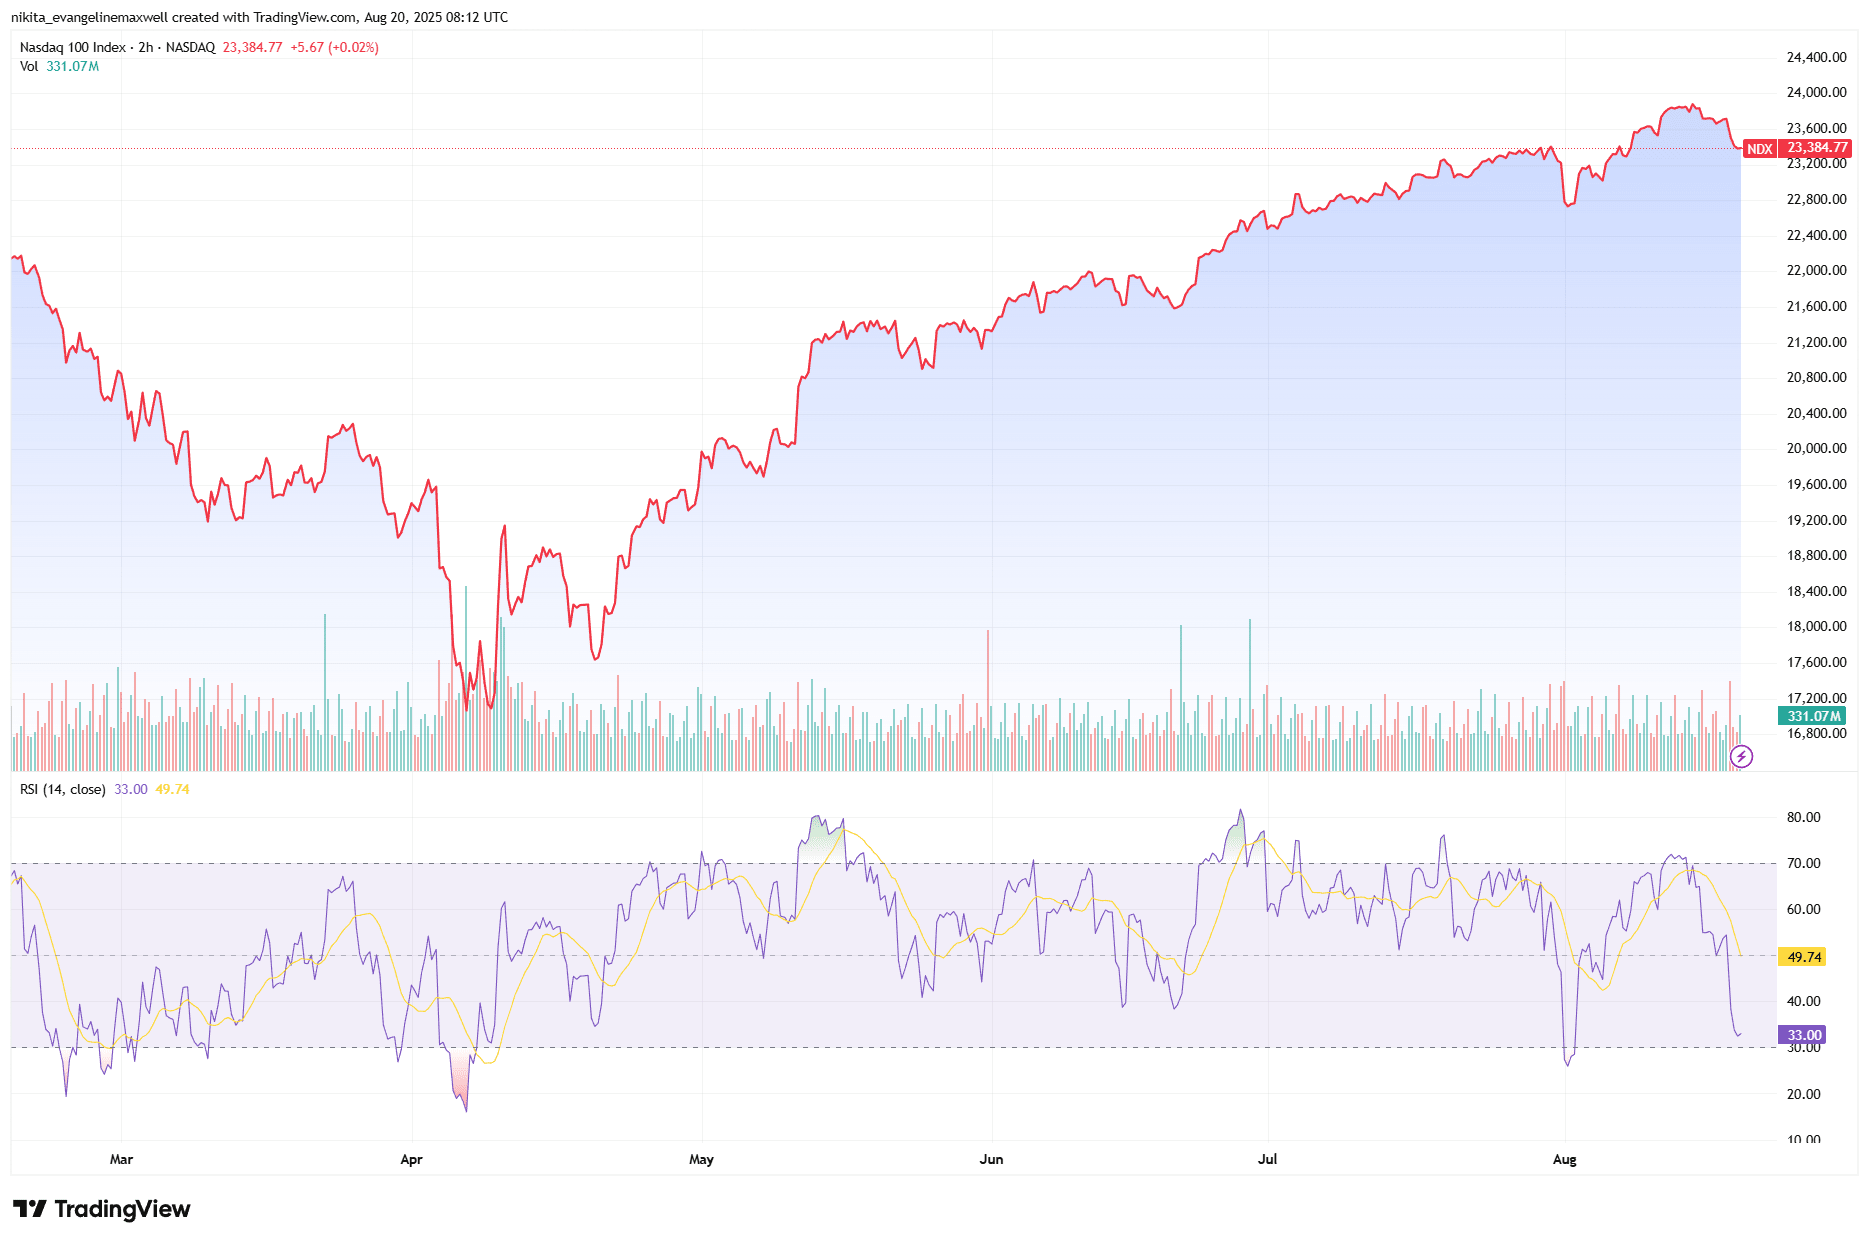
Source: TradingView. All indices are total return in US dollars. Past performance is not a reliable indicator of future performance. Data as of 20 August 2025.
Bears counter that leadership is alarmingly narrow. Outside the top tech names, most sectors aren’t confirming new highs. Momentum divergences, like the Nasdaq’s RSI topping while price edged up, suggest fading energy. Volume has thinned out compared to earlier times, often a sign of cautioun. And if one leader slips, the effect could snowball. Nvidia has already doubled from April; if it breaks below its 50-day with heavy selling, it could drag the Nasdaq lower. Likewise, if Apple stalls under resistance, it leaves the S&P without one of its anchors.
At this stage, both sides have valid arguments. The rally is alive, but fragile.
What Traders Are Watching
- Support: The 4,900-5,000 zone on the S&P, along with the 50-day average. Losing this level would be bearish.
- Resistance: The recent all-time highs near 6,500. A breakout here with volume would confirm momentum.
- Moving averages: The 50- and 100-day lines on the S&P and Nasdaq, critical to watch if they flip from support to resistance.
- Momentum: RSI slipping below 50 or a bearish MACD cross could warn of fading upside.
- Volume: A breakout with weak volume would hint at fragility.
S&P 500 Key Levels
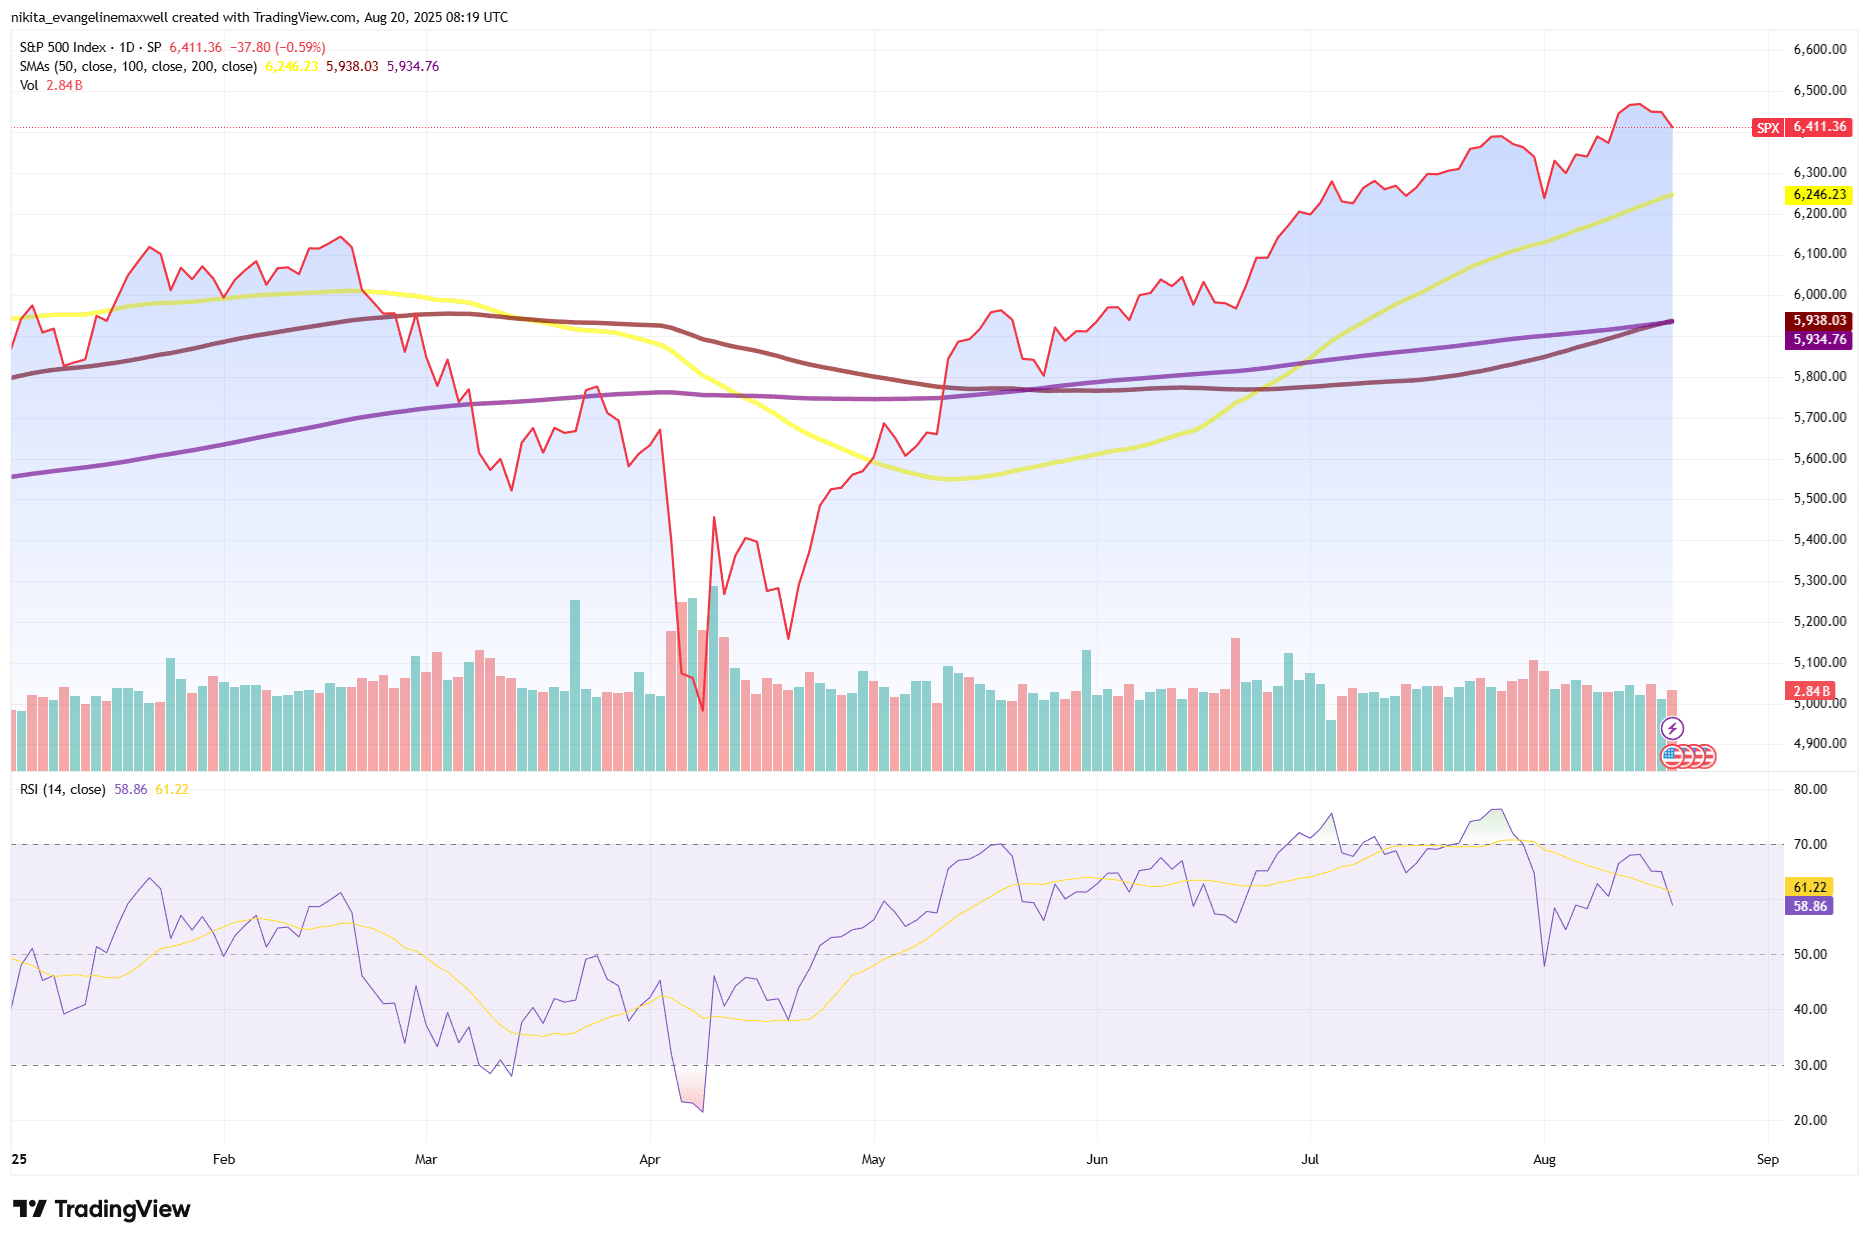
Source: TradingView. All indices are total return in US dollars. Past performance is not a reliable indicator of future performance. Data as of 20 August 2025.
Takeaway
Right now, the market’s fate rests on a handful of stocks. The charts point to an intact uptrend, but participation is thin, and that leaves the rally vulnerable. If the indices can clear recent highs with stronger buying, the run likely continues. But if momentum indicators roll over or the megacaps falter, the market’s narrow foundation could quickly be exposed. The next stretch of trading should reveal whether this is a steady climb, or the start of a slowdown.